Top Line Stats
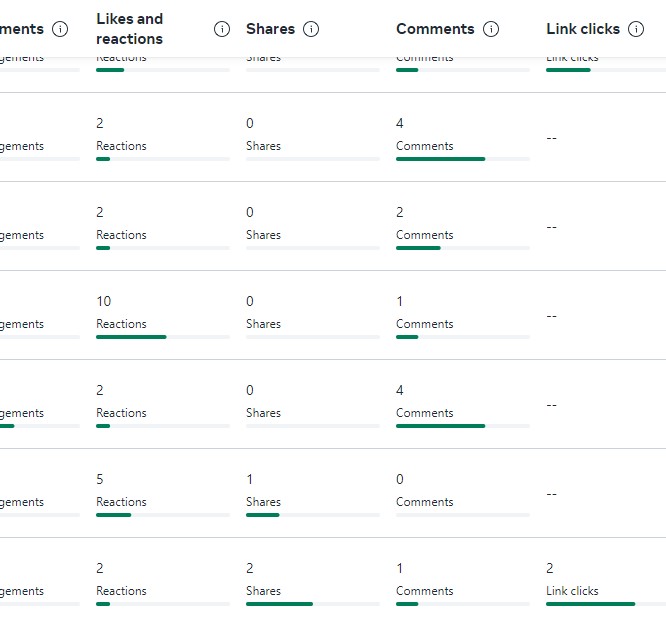
In the image you can see rows of stats for a set of published Facebook posts. These were all set up on a schedule to post at the highest traffic time for the page in question - this can change each day, per platform, per page type, etc.
Columns
- Impressions: number of times the post appeared in a newsfeed or set of results. This is your least important stat
- Reach: number of accounts the post was actually seen by. That is, how many accounts your post hit.
- Engagements: number of times someone interacted with your post
Engagement Stats
The last set of columns are a breakdown of the "Engagement" column - except image/post clicks when someone clicks "Read More" or clicks to view a larger version of the image.
Columns
- Likes and Reactions: any kind of reaction someone adds to your post (like, laugh, love, etc.)
- Shares: any time someone shares the post on their profile, or someone else's
- Comments: any comments left on the post, including those added to the shared copy of the post
- Link Clicks: this only matters if the post includes a link (URL) to an external site, another page, post, etc.


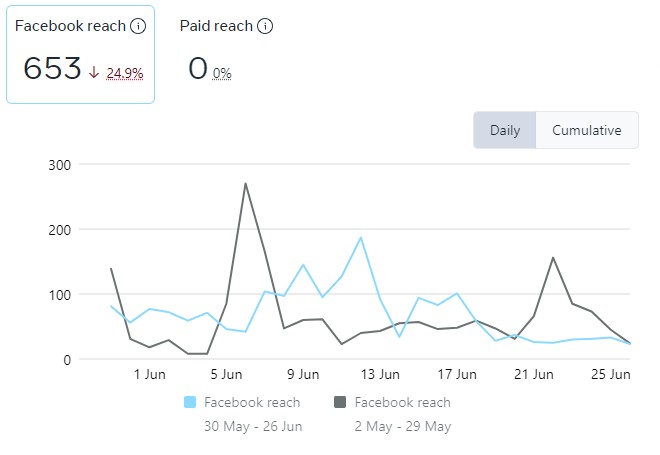
For some reason, Facebook will fill your screen with "Reach" graphs & stats, and a little box with "Engagement" totals. But, if you reach a million accounts and get zero engagement, was it really worth it?
The stat that Facebook, and others, actually care about is "Engagement". Are you keeping people logged in, reading, clicking, etc? The next most important, for you, should be "Engagement %": Engagements divided by Reach (what percentage of accounts that saw your post interacted with it?).
* If you have linked your Instagram profile to your Facebook page, you will also see stats for those posts here.
